
eCommerce Statistics 2024: Trends & Opportunities
eCommerce has revolutionized the way we shop, making it more convenient and accessible. With the growth of eCommerce, businesses have evolved, and so have consumer trends.
Our eCommerce statistics report aims to provide a complete overview of the industry by examining the latest available figures and projections that demonstrate the influence of eCommerce on the worldwide retail market.
We aim to equip industry professionals and enthusiasts with the knowledge needed to navigate and excel in this ever-evolving digital marketplace.
Key findings
Global eCommerce is expected to grow to nearly $10 trillion by 2027.
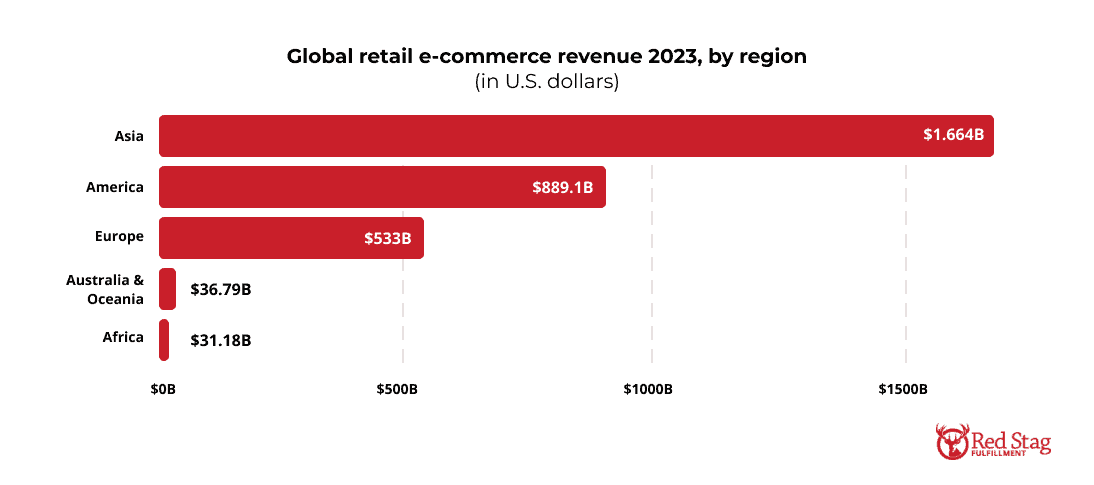
Asia online retail generated almost $1.7 trillion in revenue in 2023.
Global online shoppers spend an average of $3.95 per visit.
16% of Facebook’s active users log in just to shop on Marketplace.
By 2023, social commerce sales in the United States reached an estimated $285.2 billion.
Over 60% of U.S. adults today consider mobile shopping a necessity.
General eCommerce statistics
There were approximately 26.5 million online stores worldwide in 2023.
Approximately 2.64 billion people worldwide are expected to shop online in 2024.

China generated the highest eCommerce revenue compared to other regions in 2023.
There are expected to be 283 million online shoppers in the U.S. in 2024.
Global eCommerce statistics
Global eCommerce is projected to reach nearly $10 trillion in value by 2027, growing at more than twice the rate of physical retail.
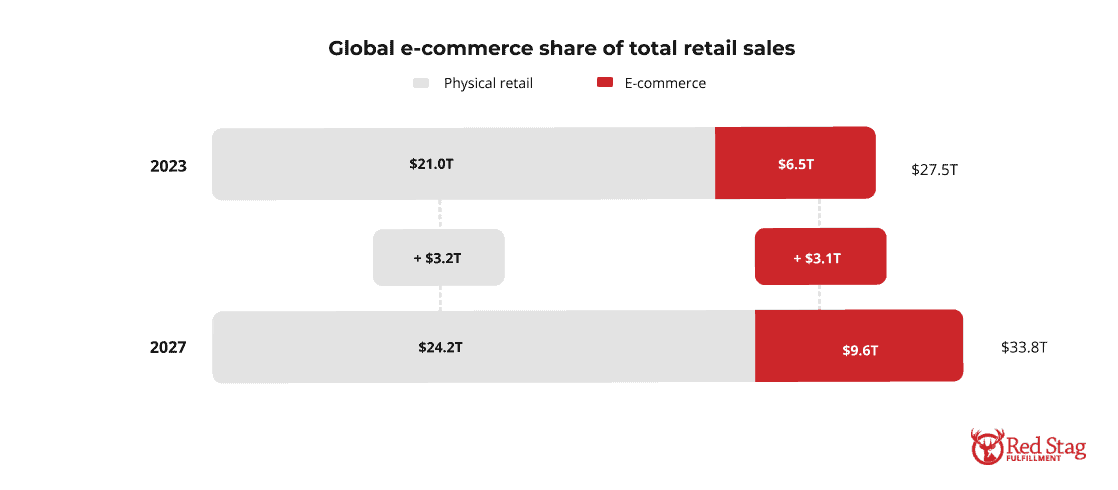
As of 2023, global eCommerce sales in the retail sector were anticipated to reach around $6.5 trillion. Experts predict this number will increase by 47.6% and reach $9.6 trillion by 2027.
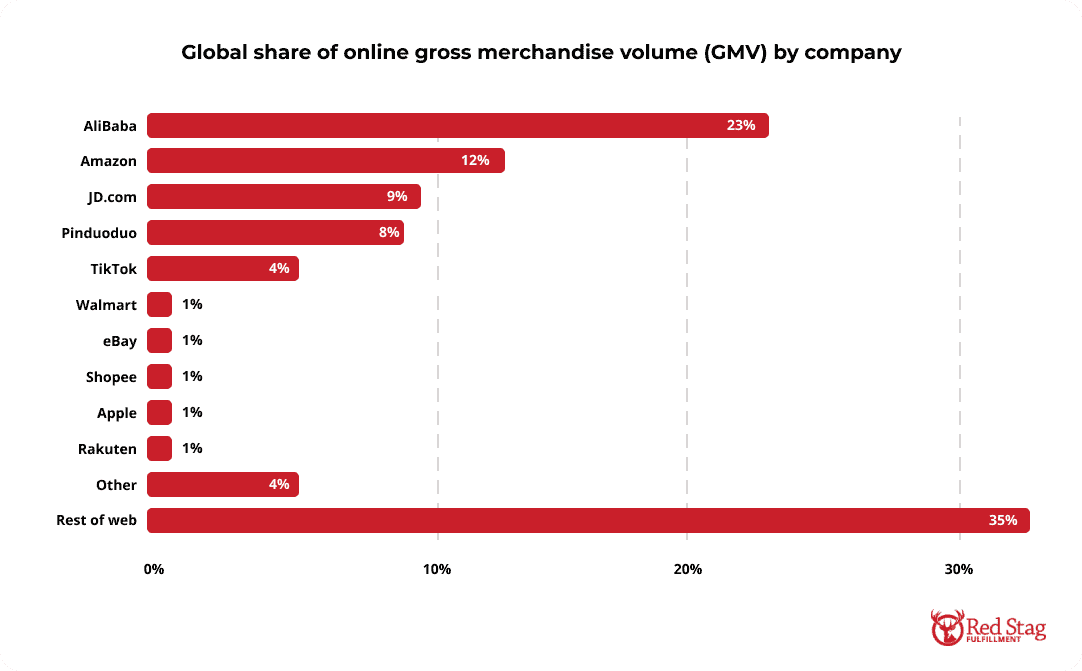
The top 10 eCommerce companies collectively achieved a remarkable $3.5 trillion in Gross Merchandise Volume (GMV) from online sales in 2022, controlling 61% of the total global online GMV. Alibaba led with a contribution of 23%.
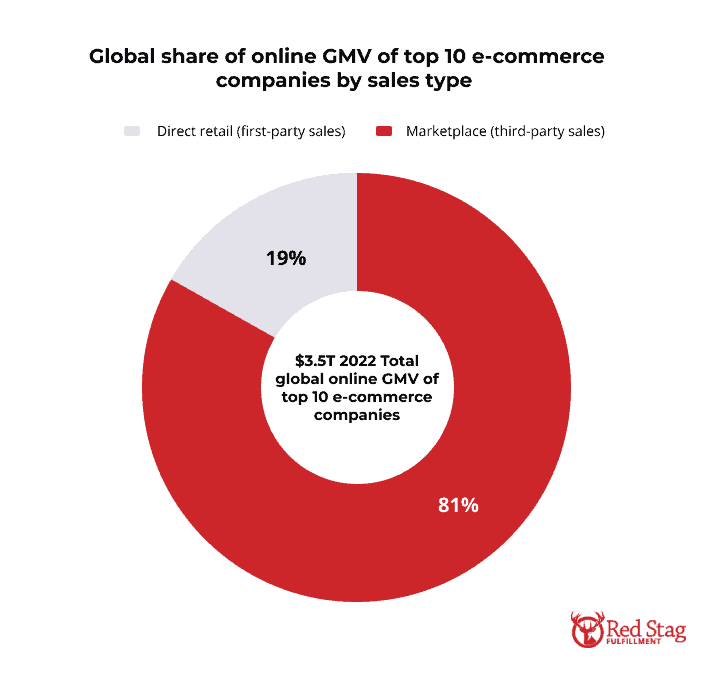
There is a noticeable difference in how this GMV is distributed between third-party sales in marketplaces and first-party sales through direct retail channels.
The vast majority of the total global online GMV (81%) results from third-party sales marketplace transactions.
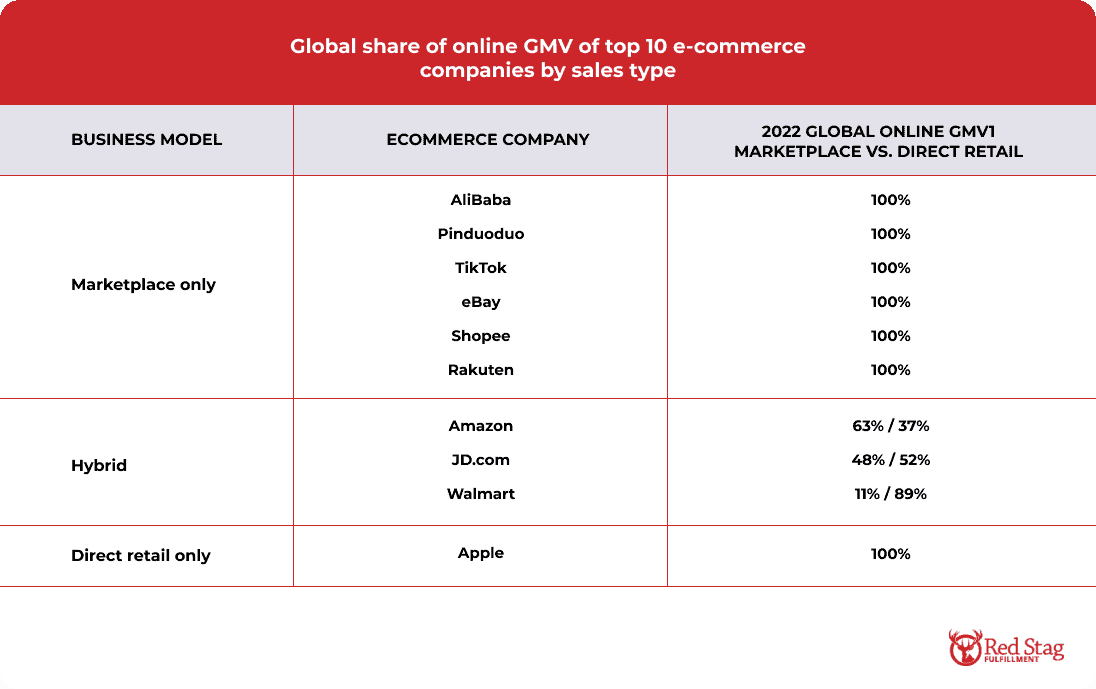
In addition to marketplace and direct retail, there is also the hybrid approach used by big companies like Amazon, Walmart, and JD.com.
eCommerce revenue by region
The total online retail revenue in Asian countries added up to nearly $1.7 trillion in 2023, approximately $800 million higher than the eCommerce revenue in the Americas.
China is the main contributor to this leading position, generating over $935 billion in revenue in 2023.
However, recent industry estimates suggest that between 2024 and 2028, the U.S. will lead the retail eCommerce growth among 20 countries worldwide, with an annual growth rate of 11.8%.
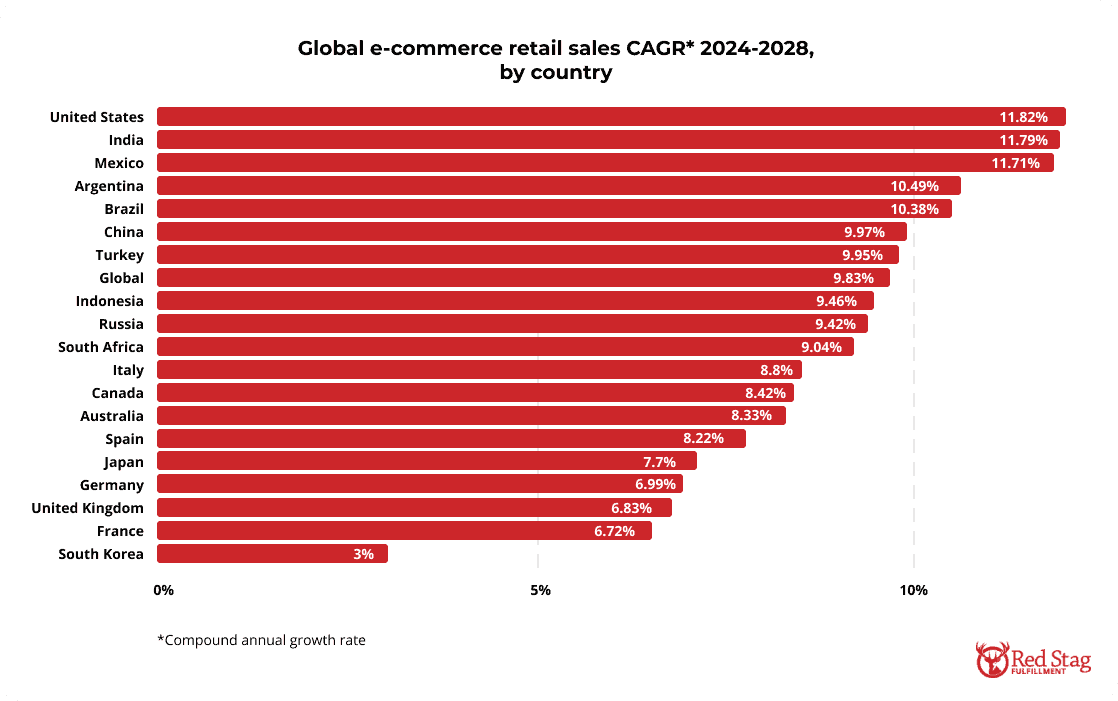
This puts the Chinese and American online shopping markets on par, depending on the key performance indicator (KPI) used. For instance, the average revenue per user is a useful KPI to determine the penetration rate of eCommerce in a country.
U.S. eCommerce statistics
According to the U.S. Census Bureau, the estimated U.S. retail eCommerce sales for the fourth quarter of 2023 was $285.2 billion, while the total retail sales were estimated at $1,831.4 billion.
Launching a marketplace has become a strategic imperative for many businesses aiming to capitalize on evolving consumer trends and unlock new revenue streams.
Strategic Drivers For Launching A Marketplace
Launching a marketplace has become a strategic imperative for many businesses aiming to capitalize on evolving consumer trends and unlock new revenue streams.

Create new revenue streams through marketplace seller fees.

Increase product assortment in existing categories to drive customer engagement and spend.

Expand into adjacent categories to build a more holistic offering and acquire new customers.

Test customer demand for new products with limited inventory risk and minimal costs.

Localize supply chains for international retailers to improve delivery speed.
Online shopping trends in the U.S.
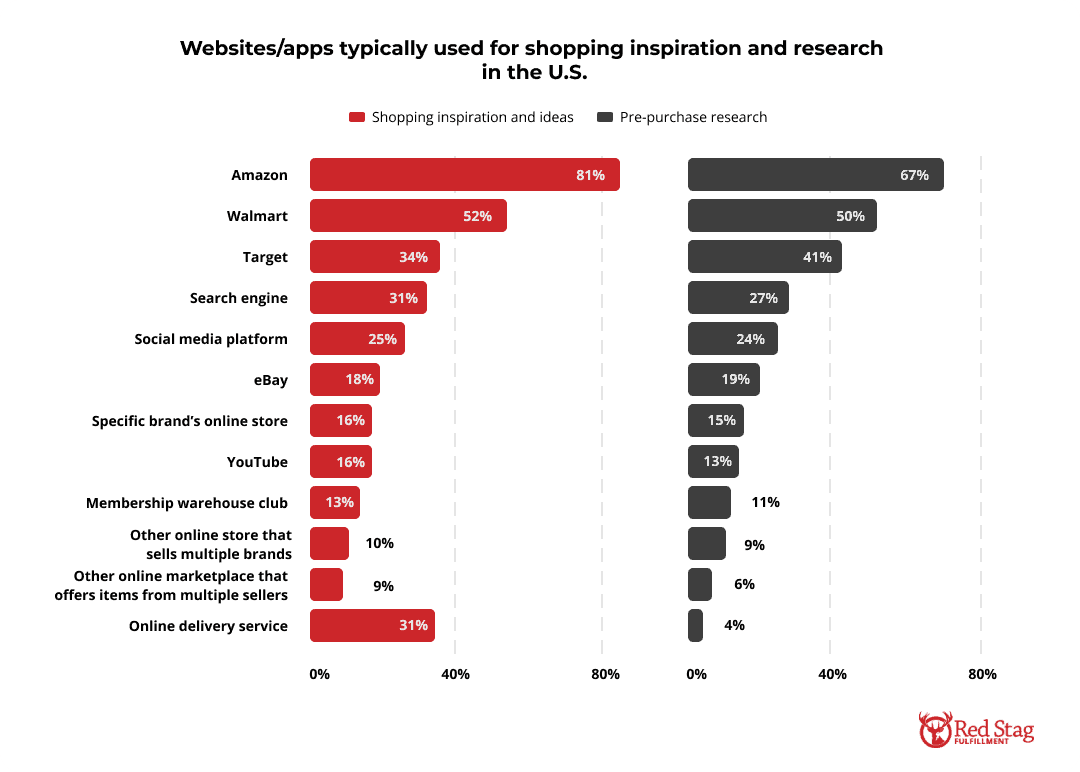
Modern-day buyers tend to use multiple online channels for shopping inspiration and research rather than sticking to a single one.
eCommerce statistics data suggests that Amazon is the most popular platform for both shopping inspiration and pre-purchase research, followed by Walmart and Target.
Social media platforms and search engines also play significant roles in both stages of the shopping process.
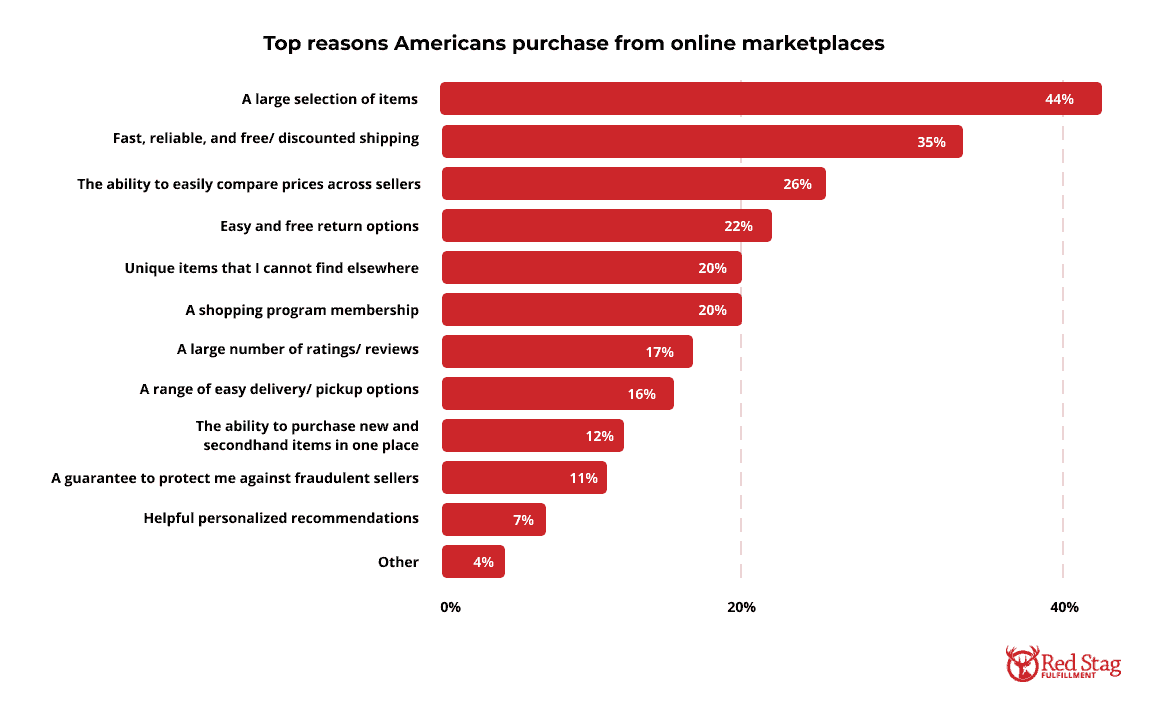
The main reasons why Americans prefer shopping on online marketplaces are the large selection of items and their quick and cost-effective delivery service.
As a result, these marketplaces and other online platforms must prioritize and enhance their fulfillment processes to remain competitive.
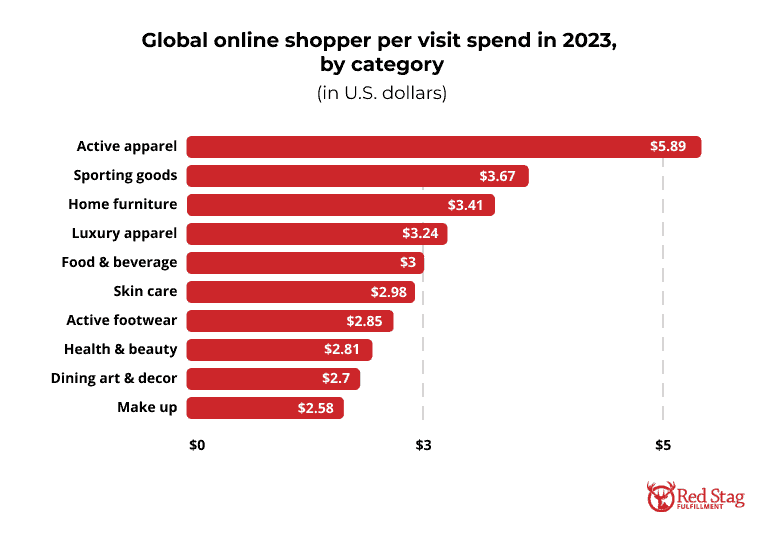
Recent studies reveal that global online shoppers spend an average of U.S. $3.95 per visit across all verticals.
Consumers tend to spend more money on fitness clothing and equipment, and home furniture.
Hence, active apparel has the highest average spending per visit at U.S. $5.89, while sporting goods and home furniture categories follow U.S. $3.67 and U.S. $3.41, respectively.
U.S. social commerce statistics
Social commerce is a new trend that combines eCommerce and social media management, helping businesses generate revenue while staying connected with their followers.
It refers to selling products and services through social media and has created quite a buzz in digital shopping.
By 2023, social commerce sales in the United States reached an estimated $64.8 billion.
As social media’s influence continues to increase, U.S. social commerce is projected to reach nearly $150 billion by 2029.

U.S. retail leaders
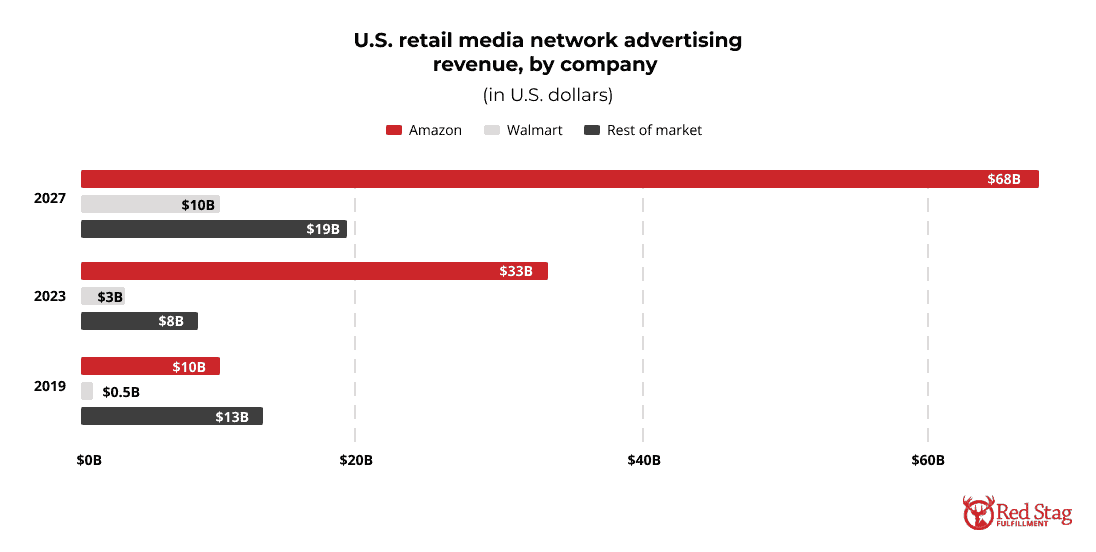
Over the years, Amazon and Walmart have shown the most significant growth in their retail media network advertising revenue.
Amazon is expected to continue dominating the market with an estimated revenue of $68 billion by 2027.
Although Walmart’s growth is comparatively smaller, it is positioning itself as a significant player in the advertising space.
As advertising spending has become increasingly concentrated on dominant platforms like Amazon and Walmart, it has led to a decrease in the rest of the market over the years.
Americans’ purchasing behaviors
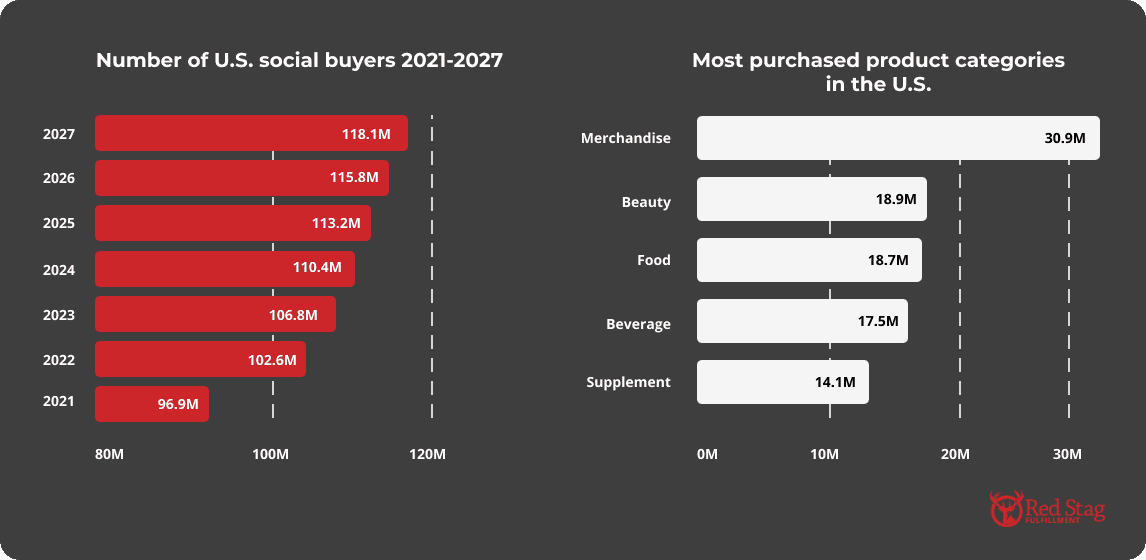
It’s estimated that in 2023, there were around 106.8 million social buyers in the United States.
This number is predicted to increase by almost 10.6% by 2027, with over 118 million Americans expected to make purchases through social networks.
Additionally, merchandise was the most popular product category among social buyers in the U.S., with up to 30.9 million merchandise products sold.
TikTok shop
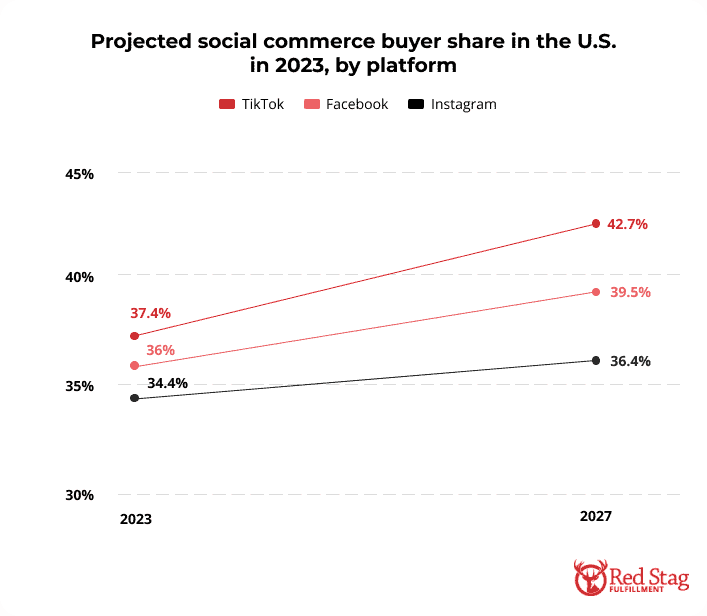
TikTok has emerged as a top inspiration and research source among younger consumers. In fact, about 37.4% of U.S. TikTok users made purchases on the platform in 2023.
Facebook and Instagram follow closely behind, with 36% and 34.4% of their users participating in social shopping, respectively.
Tiktok’s notable influence has trigger a major shift in ecommerce statistics and trends in recent years.
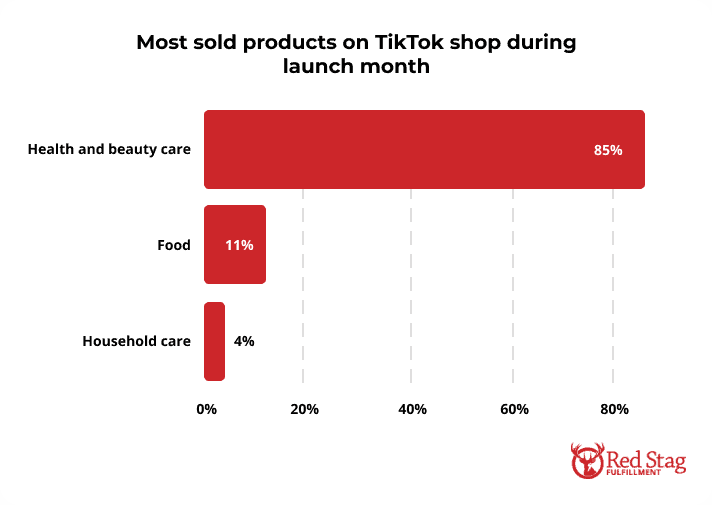
TikTok Shop made its debut in the U.S. in September 2023.
In just one month, health and beauty products were the most popular and accounted for 85% of the total sales.
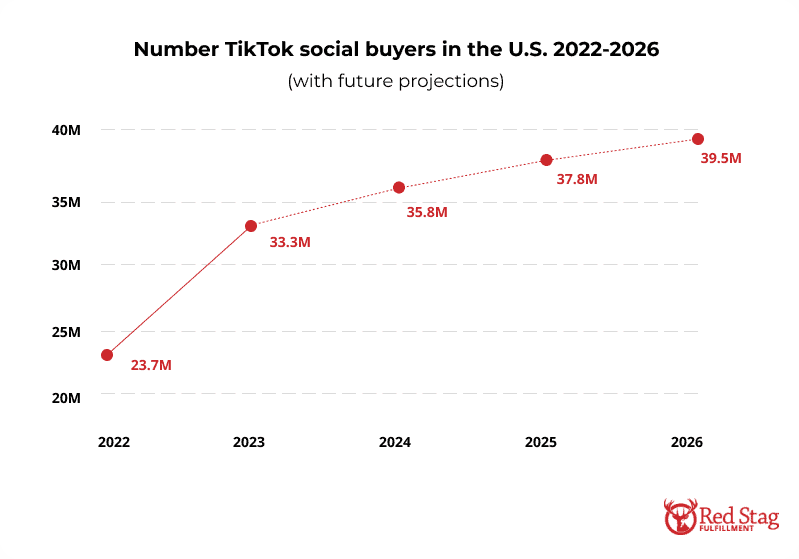
It is estimated that approximately 33.3 million TikTok users in the U.S. have bought products either through direct links on the app or the platform itself.
By 2026, this number is projected to increase to 39.5 million users purchasing products via the TikTok platform.
Instagram shopping
Influencer marketing continues to rely on Instagram as a key platform despite the growing popularity of TikTok.
46.8M
Instagram is a powerful tool for businesses to reach potential customers, with 46.8 million U.S. social buyers expected to engage with Instagram shopping posts.
42%
Approximately 42% of U.S. online shoppers have purchased at least one product from Instagram.
97.6%
Experts projected that Instagram will be used by 97.6% of U.S. marketers in 2023.
Facebook marketplace
1.212 billion online buyers
are expected to purchase on Facebook Marketplace monthly.
This number is equivalent to 40% of Facebook’s monthly active users, and a staggering 485 million, or 16% of active users, log in to Facebook just to shop on Marketplace.
In addition, the platform has a monthly average of 250 million sellers who are actively using it to sell their products and services.
This shows the immense popularity of Facebook Marketplace among both buyers and sellers, making it a crucial platform for businesses looking to expand their online presence.
M-commerce statistics
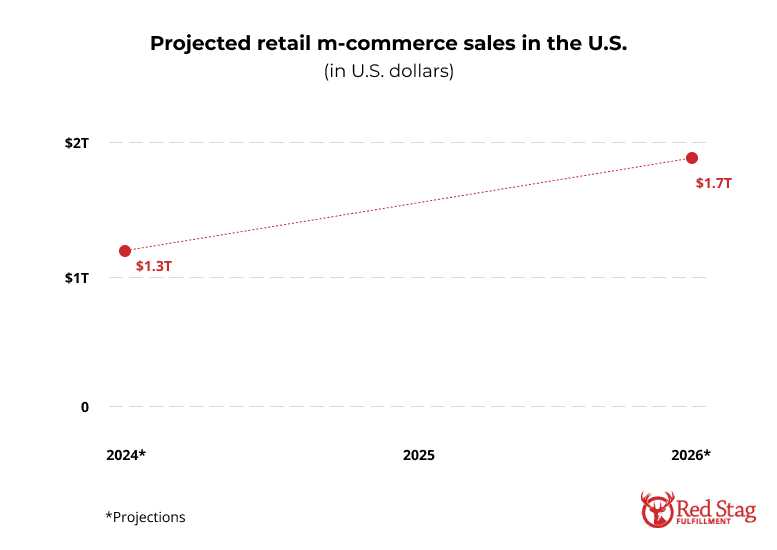
Approximately 60% of U.S. adults consider mobile shopping a necessity for its convenience in online shopping, leading to a projected increase in retail m-commerce (mobile commerce) sales.
Data suggest that 2024 retail m-commerce sales are expected to exceed $1.3 trillion and nearly $1.7 trillion by 2026.
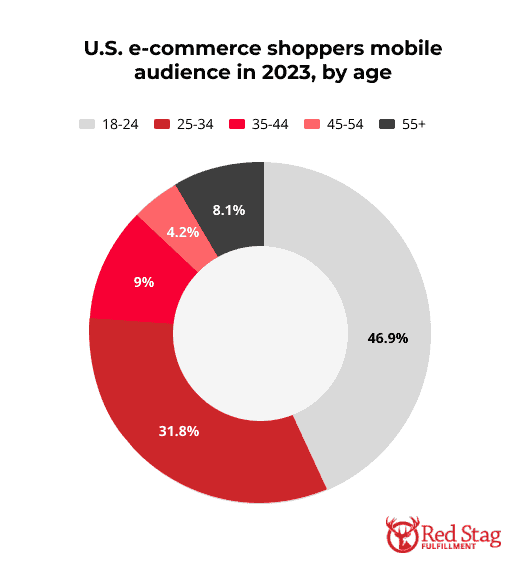
Data also shows that the majority of the mobile audience (78.7%) falls within the younger demographic, particularly the 18-24 and 25-34 age groups.
As the age increases, there is a noticeable decline in mobile audience share.
The Bottom Line
These eCommerce statistics highlight the significant role of eCommerce in the global economy and the opportunities it presents for businesses to reach customers worldwide, increase sales, and offer new products and services.
Every business has a place in eCommerce. This eCommerce report can help you see how powerful online sales can be and guide you in creating a successful online strategy of your own.
Sources
The U.S. Census Bureau Quarterly Retail E-Commerce Sales 2023
Activate Technology & Media Outlook 2024
Research and Markets the United States Social Commerce Market 2024
EMarketer: There is a (soft) ceiling to social buying
EMarketer: TikTok tests new ways to embed commerce into the in-app experience
EMarketer: US Time Spent With Social Media 2023
EMarketer: US Retail Ecommerce Sales, 2022-2026
Salesforce: Stay ahead of the curve with a look into quarterly shopping data
The Influencer Marketing Factory: The Creator Economy 2023 Report
Nielsen: Beauty retail’s newest player: What’s trending on TikTok Shop US
Meta Investor: Meta Reports Fourth Quarter and Full Year 2023