What percentage of online shoppers abandon their cart?
Last updated: September 24, 2026 · Evidence checked: September 24, 2026
About 70.22% of online shopping carts are abandoned, according to Baymard Institute’s average of 50 published studies dated 2006–2025, checked September 24, 2026. The benchmark combines research from different years; it isn’t a new survey of all online shoppers in 2026.
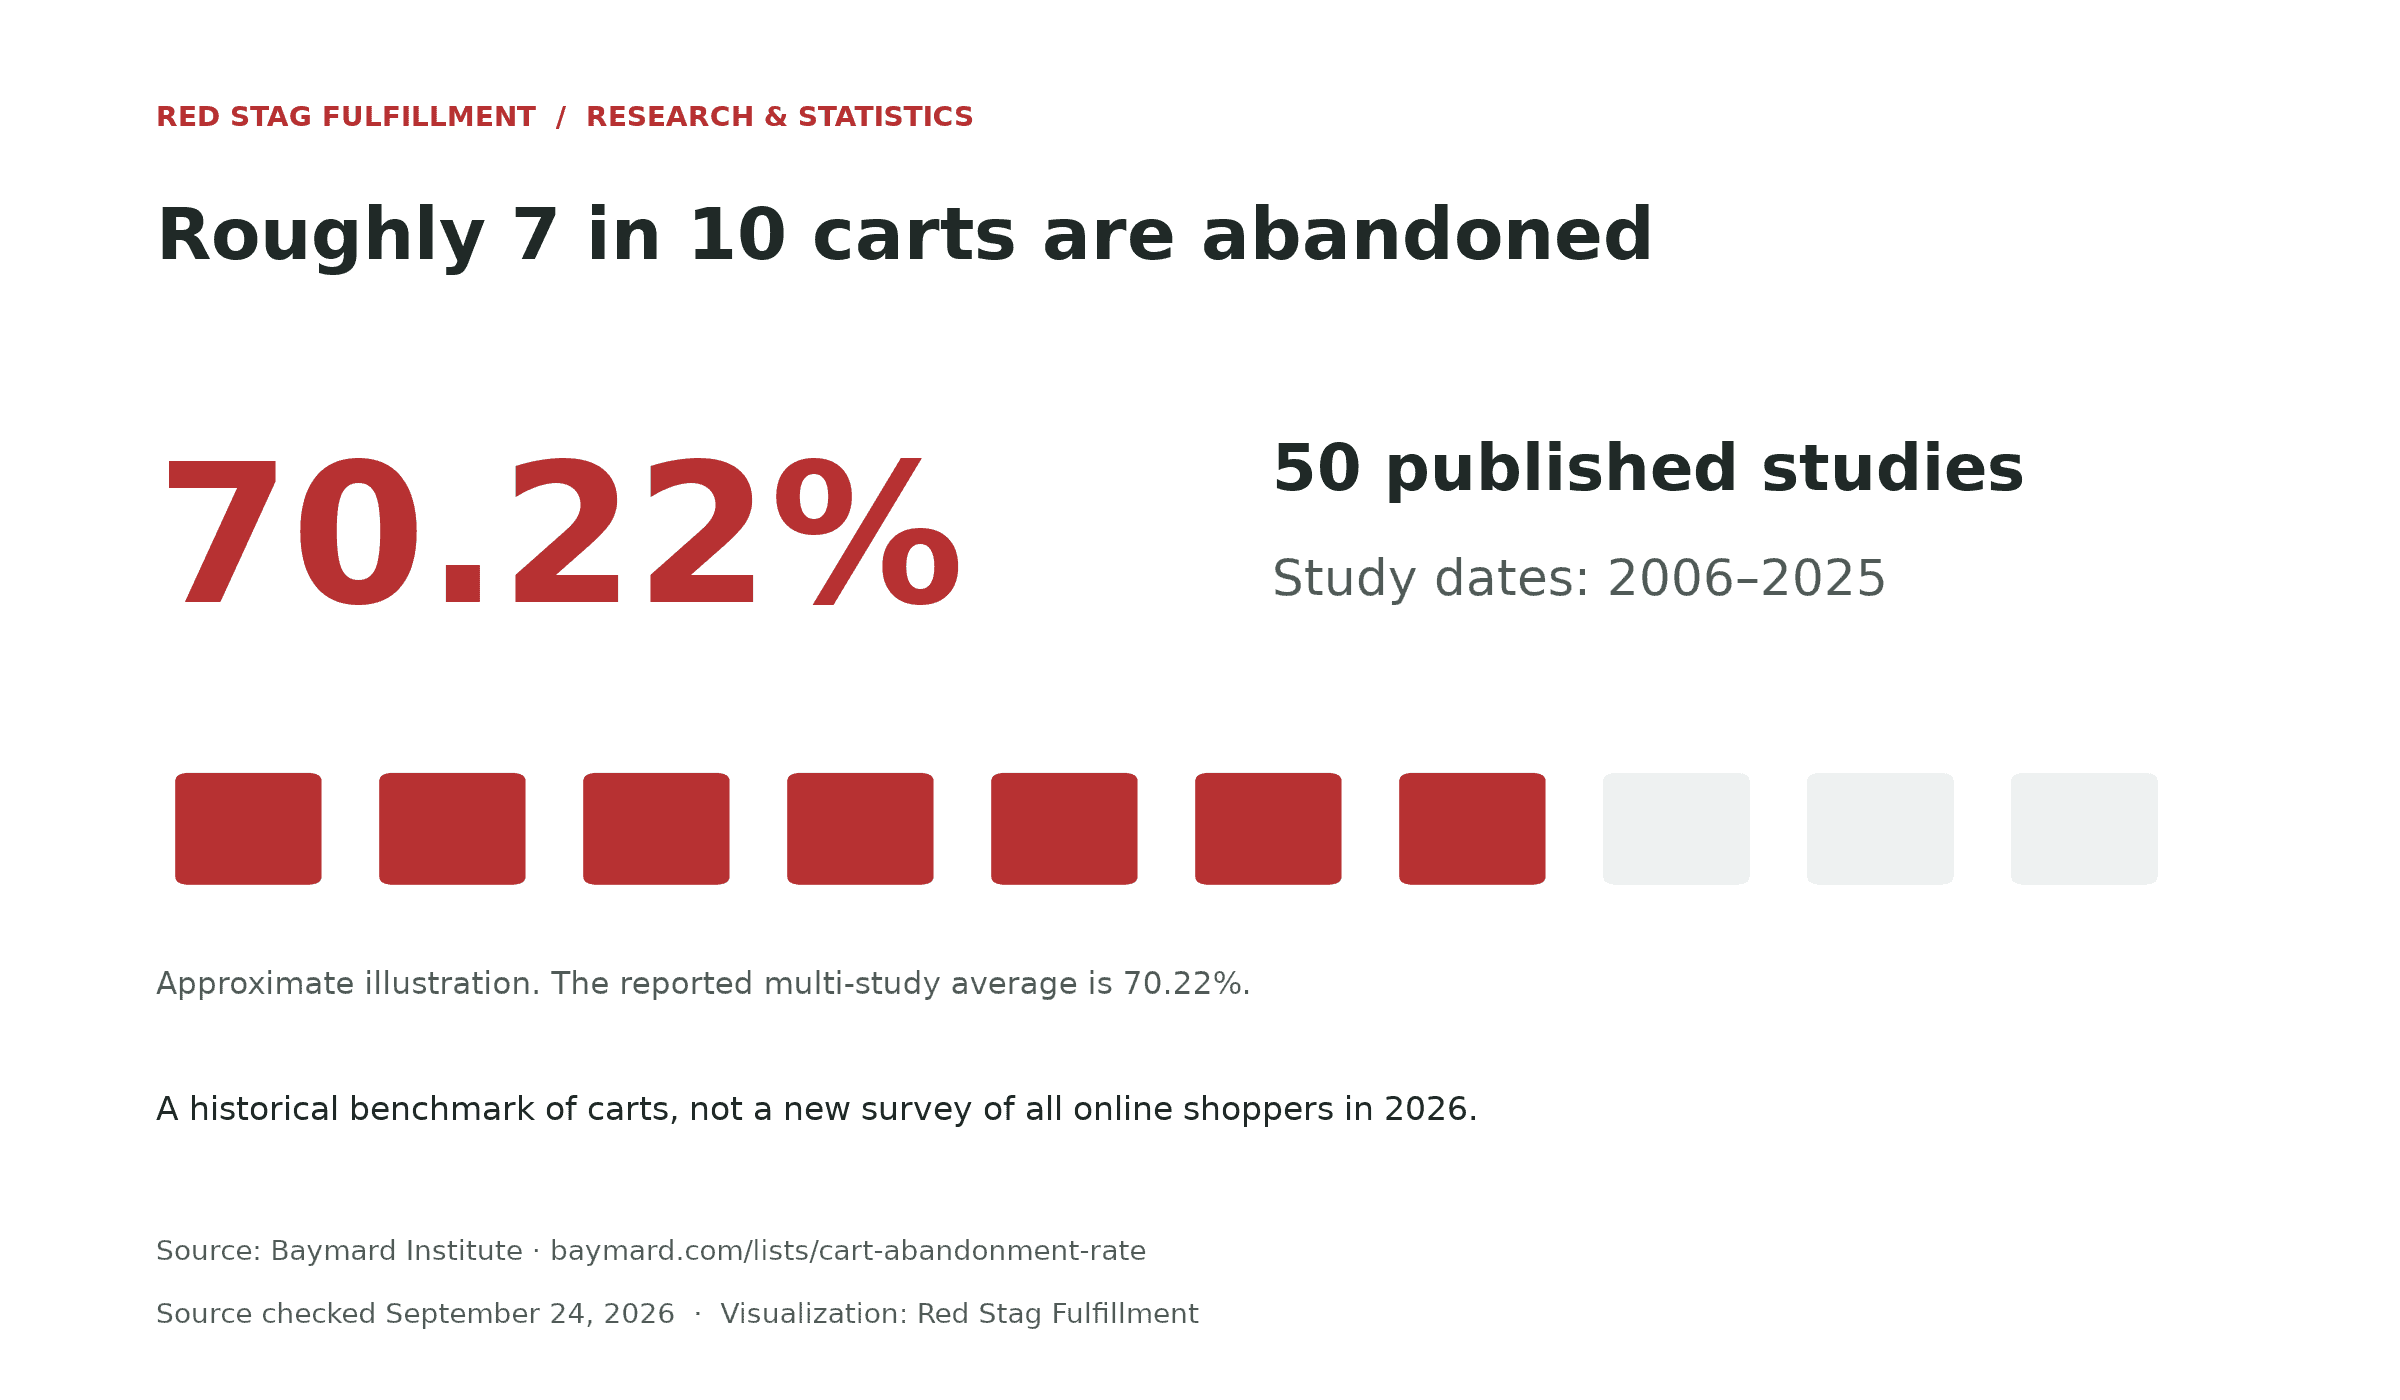
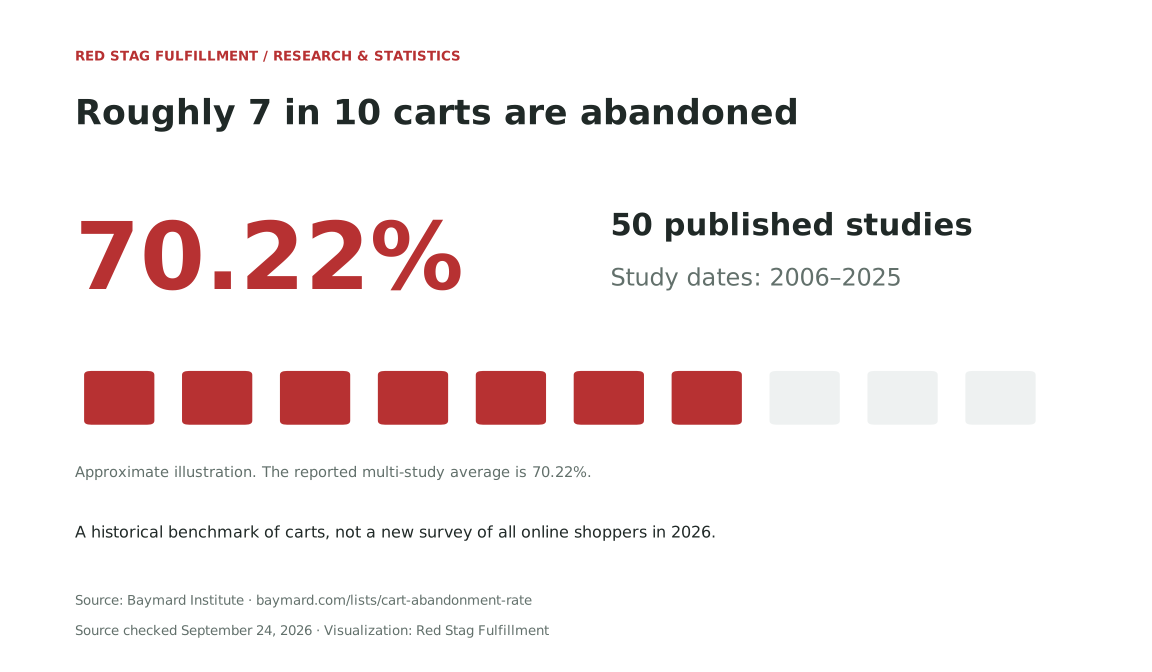
Roughly 7 in 10 carts are abandoned
Average across published abandonment studies
Approximate illustration; the reported average is 70.22%.
A historical benchmark of carts, not a new survey of all online shoppers in 2026.
Source: Baymard Institute. Checked September 24, 2026. Visualization: Red Stag Fulfillment.
Key takeaways
- The widely used 70.22% benchmark describes carts, not all website visitors.
- Device, region, and industry comparisons need the same source and reporting period.
- Shopper-reported reasons for leaving aren’t percentages of recoverable orders.
- Compare abandonment with completed orders and profit before deciding whether a change helped.
Jump to: Formula · Benchmarks · Reasons · Store checklist
What does the 70% cart abandonment benchmark mean?
The benchmark is an average of published abandonment rates, not a target every store should meet. Baymard’s list was last updated September 22, 2025. Its public explanation does not document weighting by sample size or study quality, so we don’t describe it as a weighted global census.
A rate built from studies covering different years cannot establish a year-by-year trend. To assess whether abandonment is improving, compare a consistent dataset over time. Changes in store mix, customer behavior, or measurement rules can move a benchmark even when no individual store’s checkout changes.
Your own rate also depends on who reaches the cart. Keep browsing visitors, cart creators, and checkout starters separate. For related context, see our ecommerce conversion rate benchmarks, which distinguish session-based conversion from other definitions.
How do you calculate cart abandonment?
Cart abandonment rate is the percentage of created carts that don’t become completed orders within your chosen measurement window. Start with a defined group of carts, link purchases back to those carts, and avoid counting repeat events as new carts. Use the same rules each time you report the rate.
Cart abandonment rate = (carts created − carts that become completed orders) ÷ carts created × 100
For a hypothetical group of 1,000 carts with 300 completed purchases by the cutoff, abandonment is (1,000 − 300) ÷ 1,000 × 100 = 70%. Dividing completed purchases by carts without subtracting from one would give the completion rate instead.
How is checkout abandonment different?
Checkout abandonment starts when a shopper begins checkout, so its denominator is checkout starts. Cart abandonment begins earlier, when a cart is created. For both measures, match completions to the starting group and choose a consistent cutoff for deciding whether a purchase completed.
Checkout abandonment rate = (checkout starts − completed orders linked to those starts) ÷ checkout starts × 100
In the same hypothetical example, 500 of the 1,000 carts reach checkout and 300 complete. Checkout abandonment is 40%, while cart abandonment is 70%. The difference identifies where people leave; it does not explain why.
What are the benchmarks by device, region, and industry?
The tables below use July 2026 data from Dynamic Yield’s participating ecommerce sites. July was the latest monthly period available when checked September 24, 2026. The provider’s overall rate for that month was 78.36%. This is a separate vendor cohort, so it should not be read as an increase from Baymard’s multi-study average.
The source page also displays a headline average of 77.55% and summaries spanning twelve months. The tables here isolate July’s monthly observations. Check several comparable monthly periods before adopting a category target.
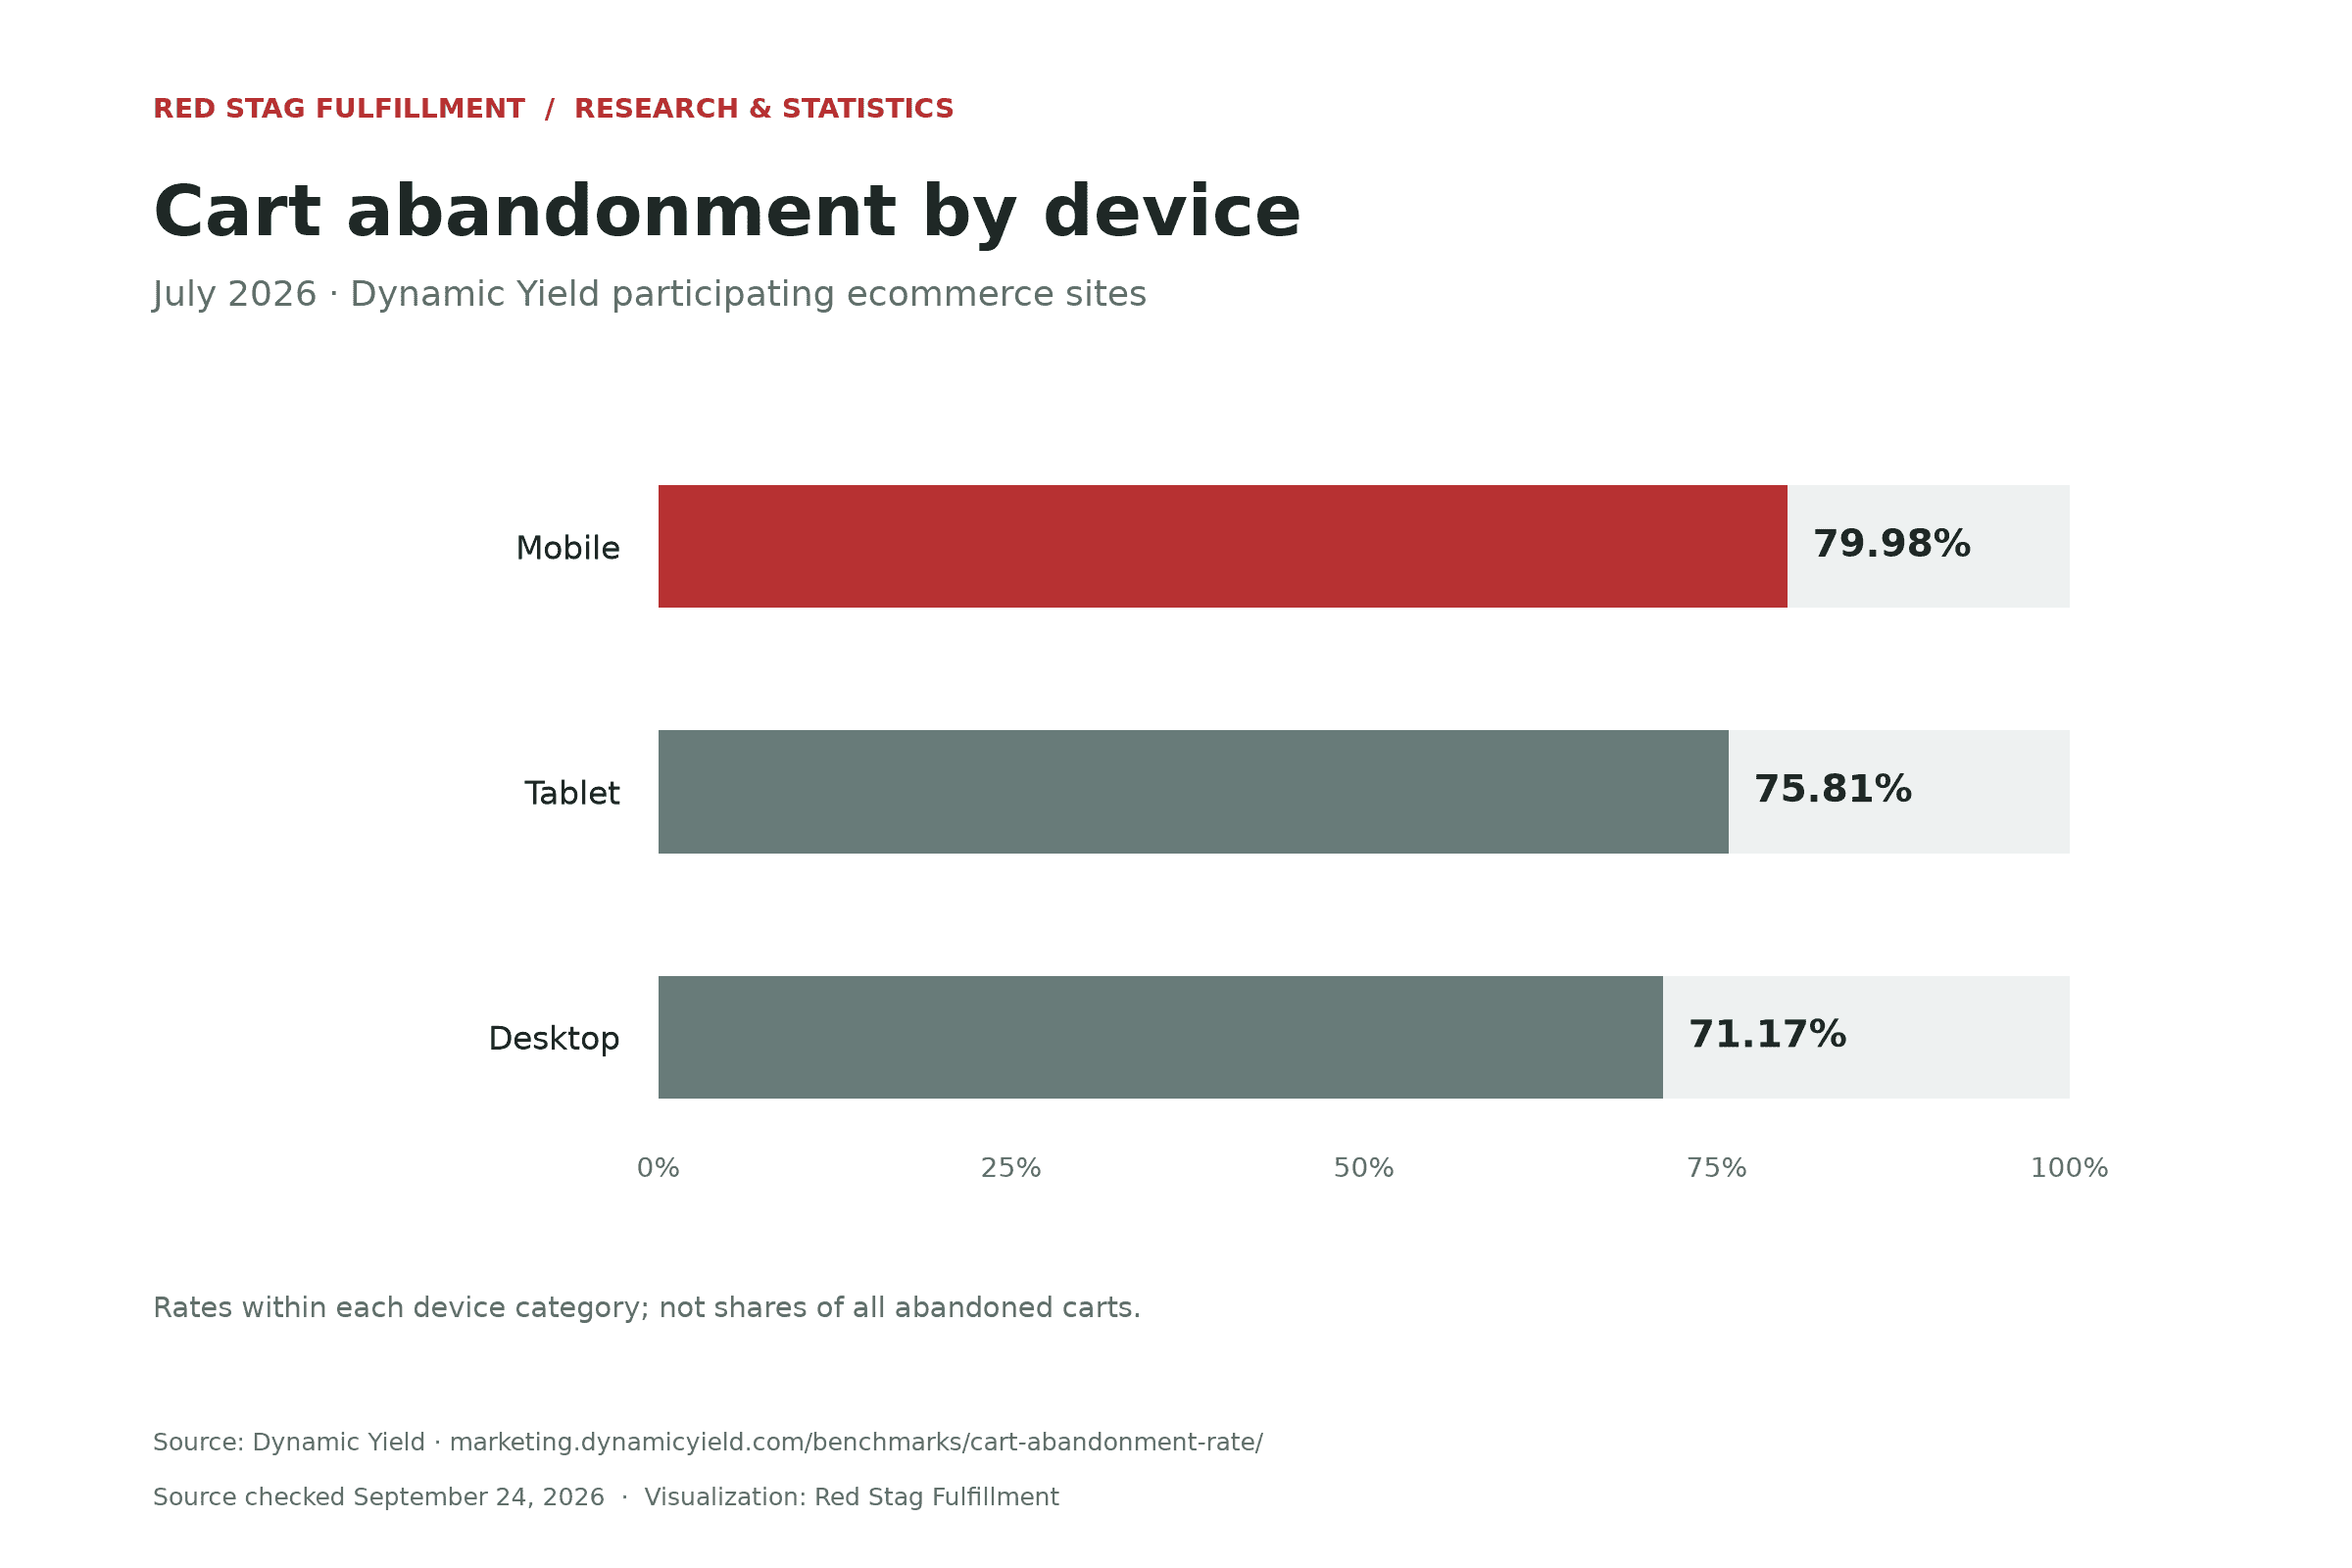
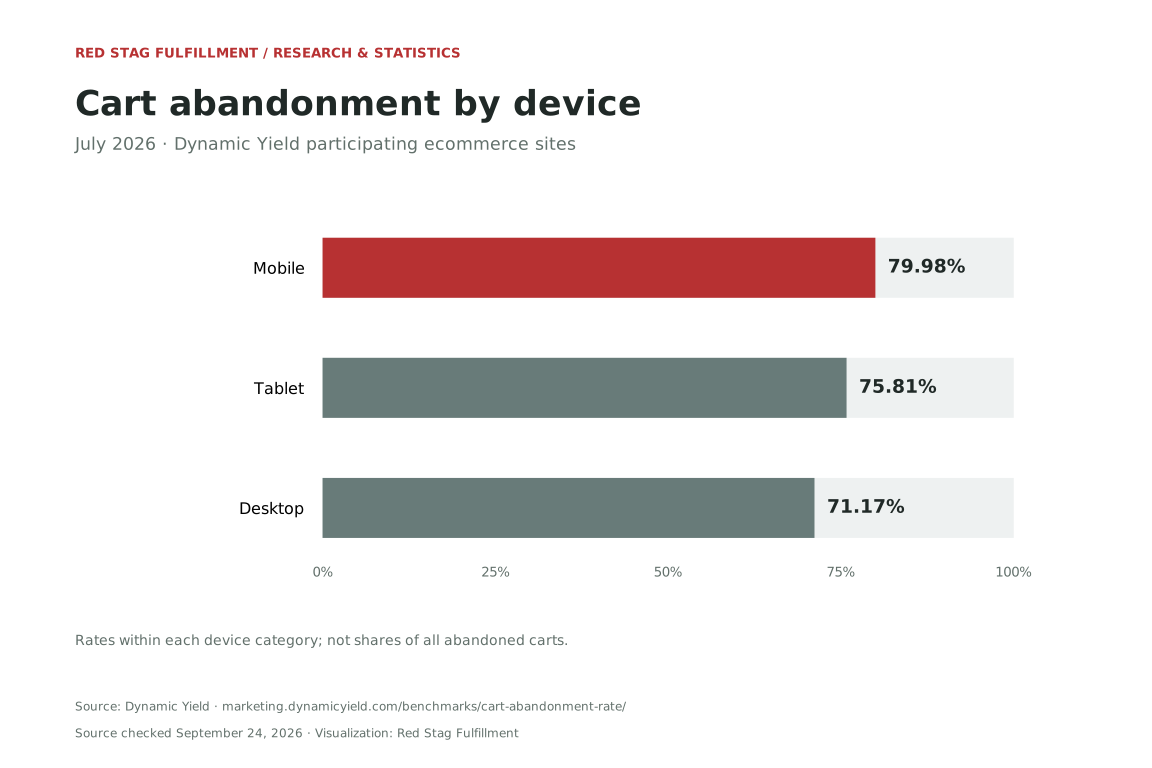
Mobile has the highest device rate
July 2026 · Dynamic Yield participating ecommerce sites
These are rates within each device category, not shares of all abandoned carts.
Source: Dynamic Yield. Checked September 24, 2026. Visualization: Red Stag Fulfillment.
View the data table
| Device | Cart abandonment rate, July 2026 |
|---|---|
| Mobile | 79.98% |
| Tablet | 75.81% |
| Desktop | 71.17% |
The device comparison alone cannot tell you whether the gap comes from customer intent, the checkout experience, or other differences.
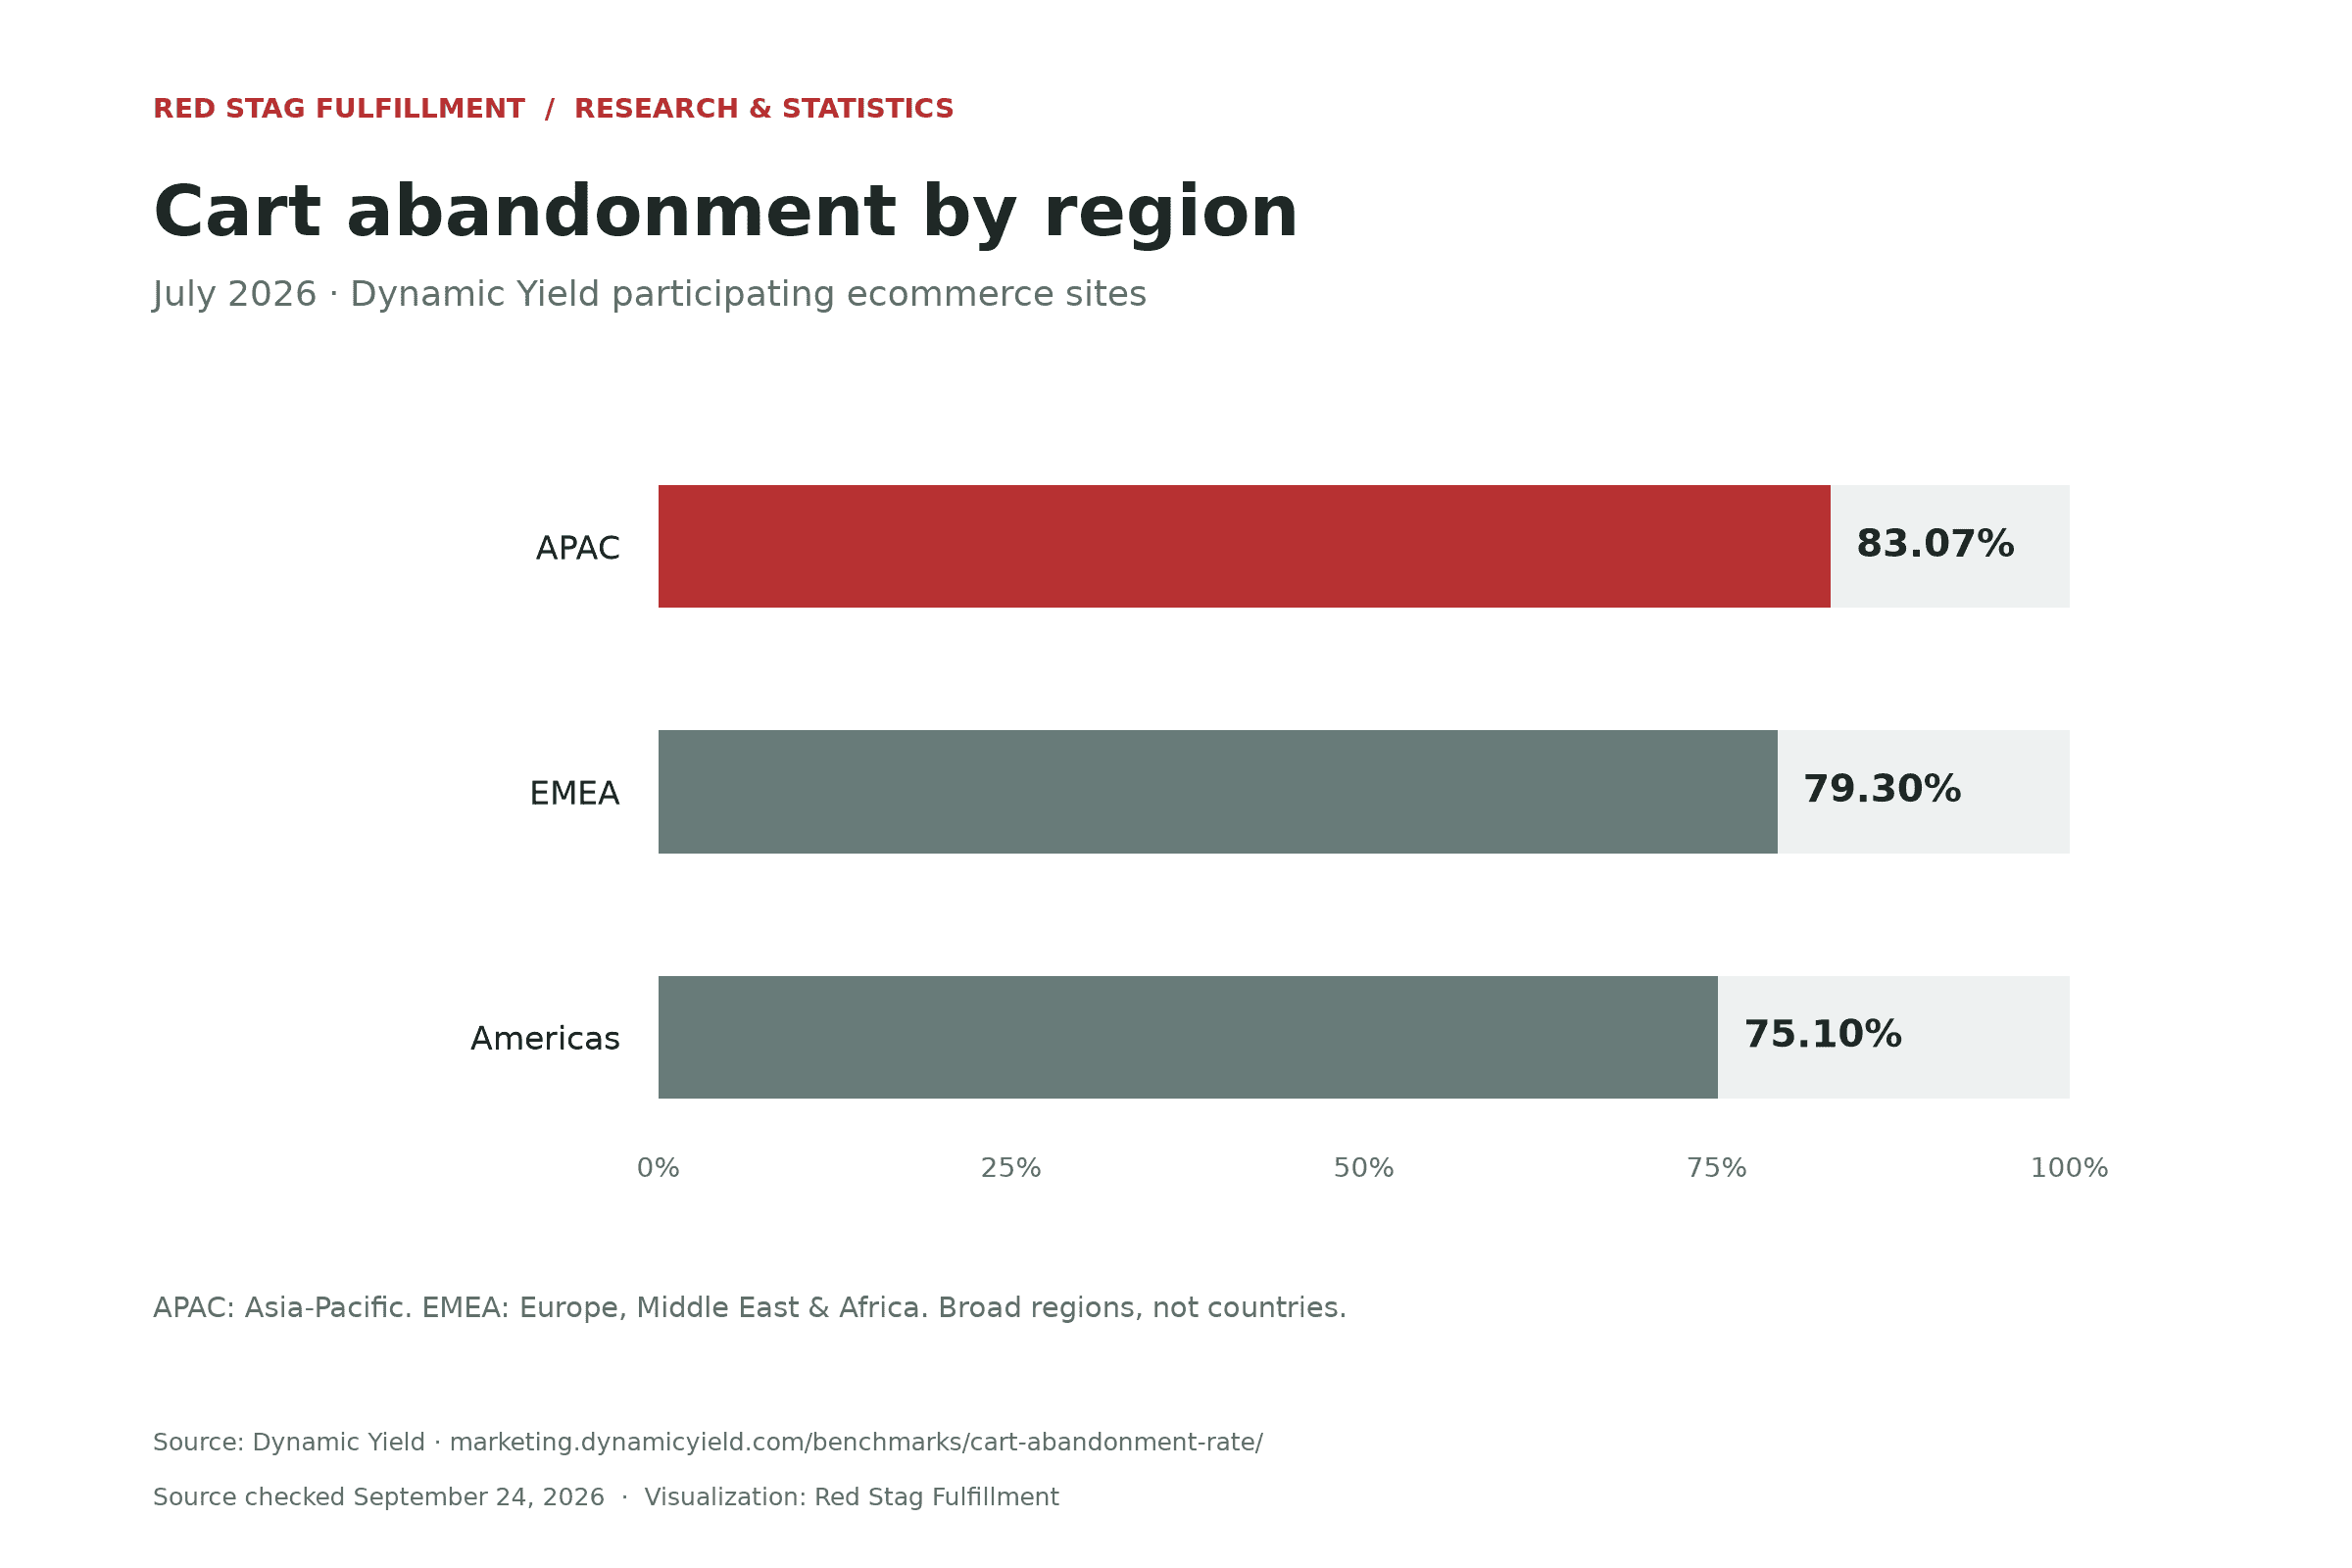
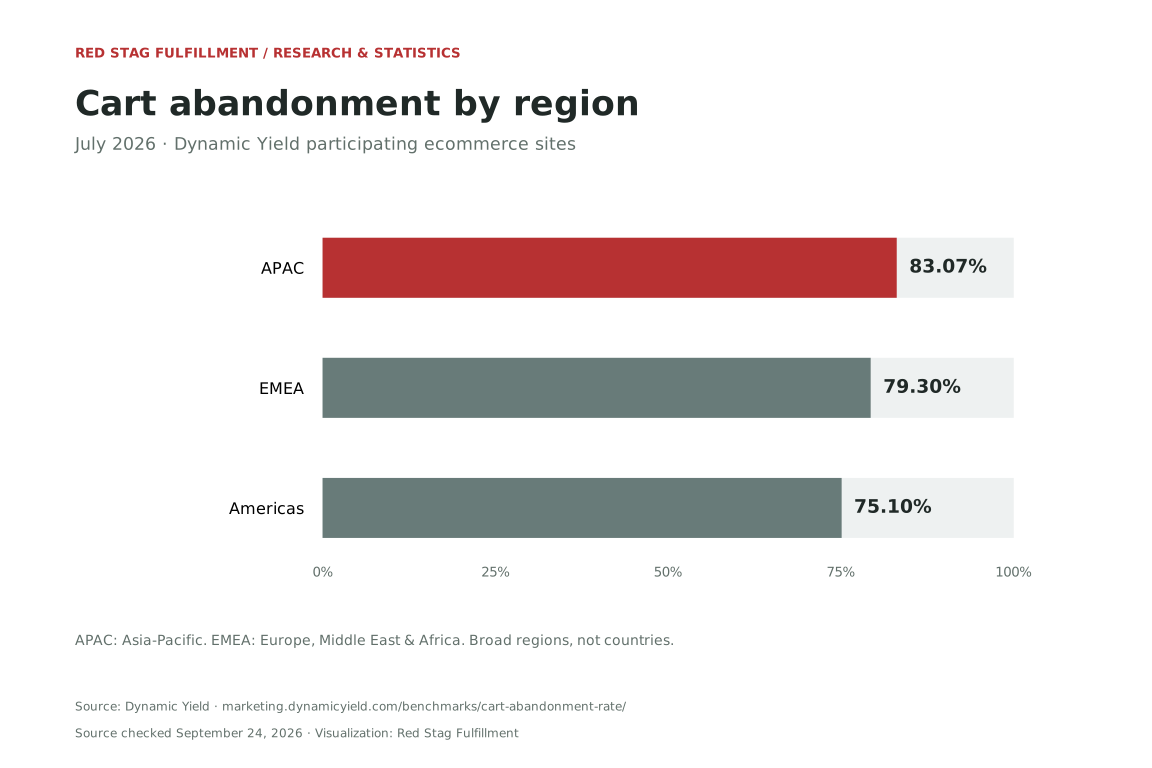
Regional benchmarks, one source and month
July 2026 · Dynamic Yield participating ecommerce sites
APAC means Asia-Pacific. EMEA combines Europe, the Middle East and Africa. These are broad regional groups, not national rates.
Source: Dynamic Yield. Checked September 24, 2026. Visualization: Red Stag Fulfillment.
View the data table
| Region | Cart abandonment rate, July 2026 |
|---|---|
| APAC (Asia-Pacific) | 83.07% |
| EMEA (Europe, Middle East & Africa) | 79.30% |
| Americas | 75.10% |
These broad regional groups cannot supply a United States-only benchmark. EMEA also combines Europe with the Middle East and Africa, so its rate should not be relabeled as Europe’s rate.
Industry benchmarks at a glance
| Industry | Cart abandonment rate, July 2026 |
|---|---|
| Food & Beverage | 81.92% |
| Beauty & Personal Care | 80.35% |
| Luxury & Jewelry | 79.68% |
| Fashion, Accessories, and Apparel | 78.79% |
| Multi-Brand Retail | 78.45% |
| Home & Furniture | 75.54% |
| Consumer Goods | 71.65% |
| Pet Care & Veterinary Services | 46.95% |
Source: Dynamic Yield, July 2026 monthly benchmark data.
Rates ranged from 46.95% for Pet Care & Veterinary Services to 81.92% for Food & Beverage in this July 2026 cohort. That variation is a reason to check category and period before adopting a target. It does not establish that product price, repeat purchasing, or shipping cost caused the differences.
Why do shoppers abandon carts?
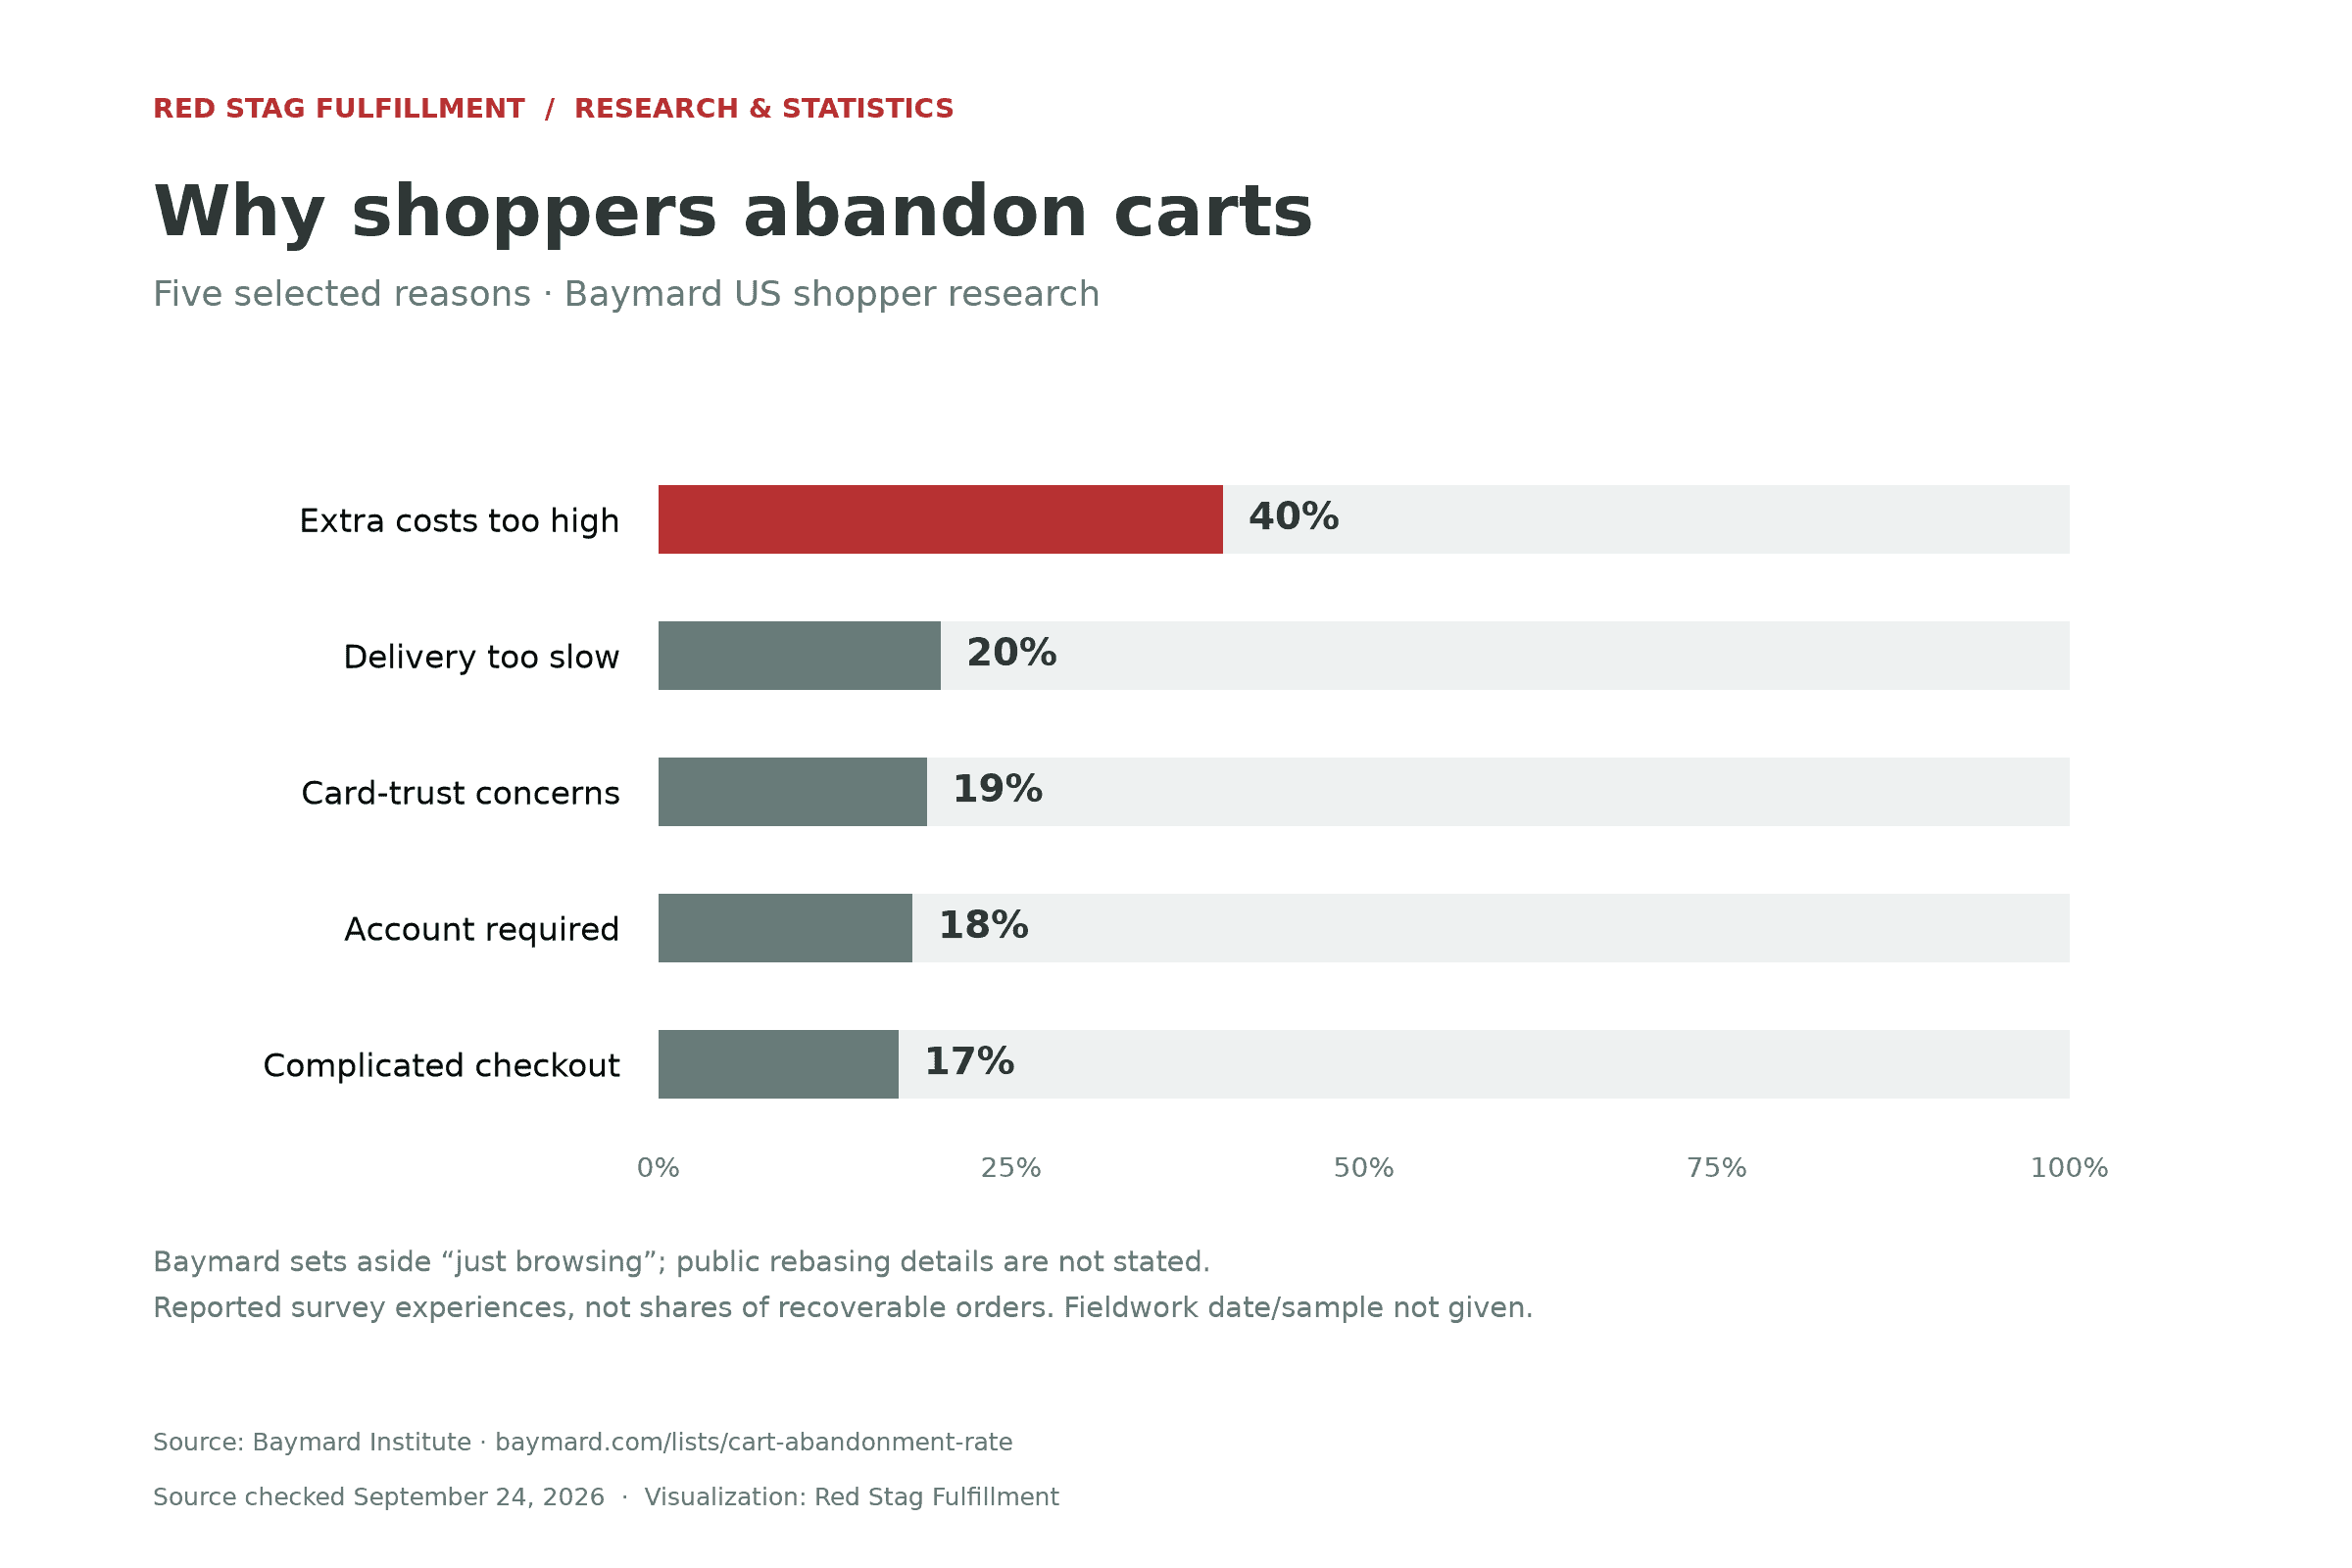
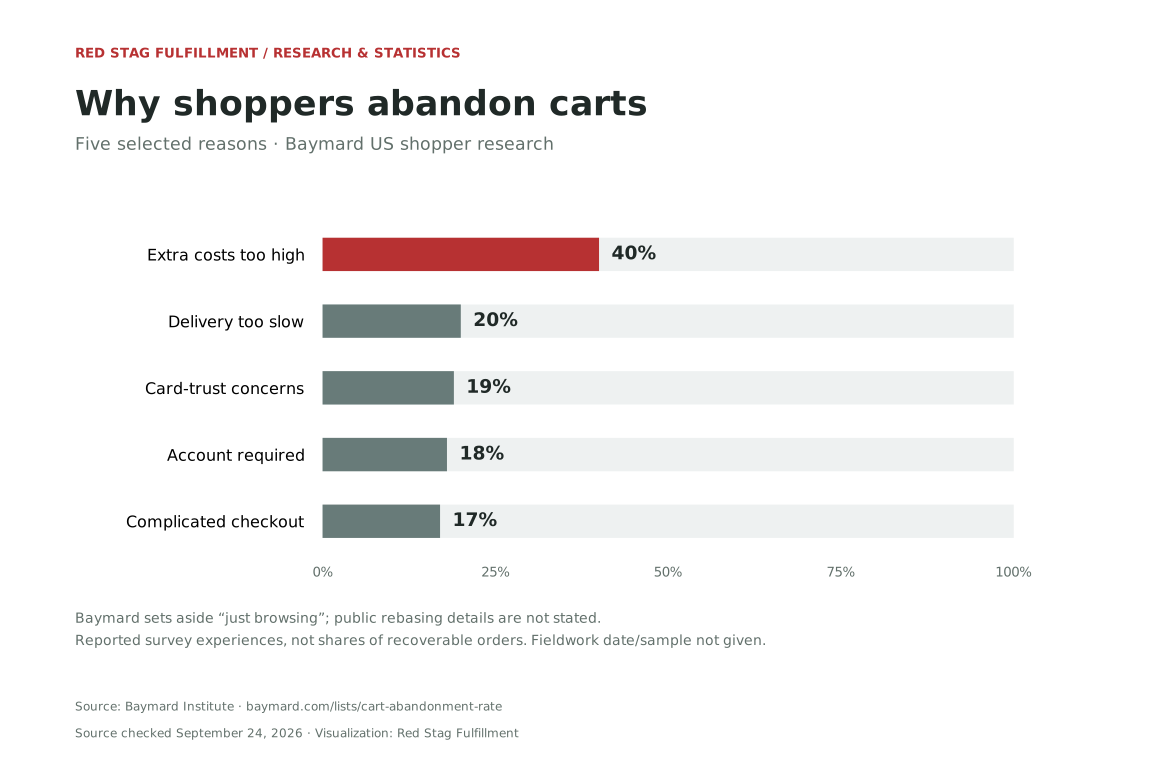
Baymard’s current statistics page reports that 42% of US online shoppers have abandoned a cart because they were just browsing or not yet ready to buy. Baymard says its chart sets aside the ‘just browsing’ segment to show the remaining reasons. The table below reproduces five selected reasons from that chart; the public page does not explain whether its percentages are rebased to a different respondent group.
Five selected reasons · Baymard US shopper research
Baymard sets aside the ‘just browsing’ segment. The public page does not explain whether the percentages are rebased. These are reported experiences, not exclusive shares of carts or recoverable orders.
Source: Baymard Institute. Checked September 24, 2026. Fieldwork dates and sample size not stated on the public page. Visualization: Red Stag Fulfillment.
View the data table
| Reported reason | Share reporting the reason in the source chart |
|---|---|
| Shipping, tax, or other added costs were too high | 40% |
| Delivery was too slow | 20% |
| Concern about trusting the site with card details | 19% |
| An account was required | 18% |
| Checkout was too long or complicated | 17% |
These are shopper-reported experiences. They are not exclusive portions of all abandoned carts, and they cannot be added together to estimate recoverable sales. The 42% browsing result also does not mean exactly 42% of your store’s abandoned carts came from people who were only browsing.
What should you check first?
Use the research to choose what to inspect, then confirm the problem in your own checkout. Start with the points where shoppers see a new cost, receive a delivery estimate, enter an address, or attempt payment. A useful check ends with an observed problem and a specific proposed fix.
Show shipping costs, taxes, and fees early enough for shoppers to judge the full order cost. When an exact quote needs an address, explain that dependency and provide an estimate where possible. Don’t assume displaying a high charge more clearly will make the charge acceptable.
For delivery speed, show an achievable arrival estimate that includes order processing and transit. Furniture and heavy-item sellers should also explain delivery arrangements and any service charges. A fulfillment partner can help execute the promise; changing checkout copy alone cannot make a slow service faster.
Test guest checkout and complete the address and payment steps on a phone. Check that errors explain what needs correcting and that a failed payment does not erase the customer’s work. Treat these as inspection priorities, not guaranteed conversion improvements.
What does abandonment mean for revenue?
An abandonment percentage does not measure lost revenue. Multiplying 70% by completed ecommerce sales mixes a cart-count rate with a sales-value total. It cannot tell you the value of abandoned merchandise or how much shoppers would have purchased after a change.
Estimate the value of abandoned carts from your own records, remove duplicate carts and test activity, and separate cart value from sales you can realistically recover. Evaluate extra completed orders against discounts, payment fees, shipping subsidies, product costs, and returns when estimating additional profit.
For a recovery campaign, compare eligible shoppers who receive the treatment with a suitable control group. Counting every purchase after an email as a sale caused by that email overstates its effect when some shoppers would have returned anyway.
How should you benchmark your own store?
Use a stable definition and comparable segments before setting an improvement target. Record the cart identifier, completion window, purchase-linking rule, reporting period, and segment filters. A refreshed dashboard is not evidence of improved performance if the underlying definition changed.
Review weekly for operational problems and use matched monthly or seasonal periods for broader comparisons. This is a suggested cadence; choose intervals with enough orders for your store. Compare mobile with mobile, the same regions, and similar traffic sources. Examine average order value alongside abandonment rather than assuming a higher price caused a higher rate.
There is no supported universal rule that 65% is good or 55% is excellent. Losing low-intent traffic can lower abandonment while reducing total orders. Read the rate alongside completed orders and profit, and use a controlled test where practical before attributing a change to checkout work.
Frequently asked questions
What is a good cart abandonment rate?
A useful benchmark starts with your own history under a consistent measurement definition. Compare similar customer segments and reporting periods, then judge a change alongside completed orders and profit. Published category rates provide context, but there is no supported universal threshold every store should aim for.
Are recovery emails counted as recovered abandonment?
A later purchase can count as recovery, but whether it changes the original abandonment rate depends on the reporting window and purchase-linking rules. Record recovered orders separately, deduplicate revenue, and distinguish purchases attributed to an email from additional purchases the email actually caused.
Does buy-now-pay-later reduce abandonment?
Buy-now-pay-later is a payment option to test against your customers’ needs. Evaluate its effect on abandonment in your own store. Compare completed purchases and net contribution after payment fees and other costs; avoid assuming a higher checkout completion rate guarantees higher profit.
How many carts are abandoned worldwide?
A percentage alone cannot provide a worldwide cart count. That would require a compatible total number of carts over a defined period. The studies in a multi-study benchmark use different samples and dates, so multiplying the average by an unrelated global sales total will not produce that count.
Can better checkout UX lower abandonment?
Yes, fixing a checkout problem can help shoppers finish purchases. The effect depends on the problem and the customers encountering it. Inspect failed payments, address-entry errors, account requirements, and unexpected costs, then test the relevant change. Browsing intent and expensive delivery require different responses from a broken form.
Sources and references
- Baymard Institute: Cart abandonment rate statistics. Multi-study benchmark and current US shopper reasons chart; checked September 24, 2026.
- Dynamic Yield: Shopping cart abandonment benchmarks. Device, region, and industry rates from the July 2026 monthly series. Underlying published data.
- Baymard Institute: Cart and checkout usability research. Checkout research context; the statistics list above is the source for the headline rate.